A neighborhood summary lists 20% in one area and 80% in another. Averaging those two numbers produces 50%, but that may not be the share for the two areas combined. The missing information is how many observations stand behind each percentage. Our original example gives the smaller group 100 responses and the larger group 400, then follows the counts all the way to the combined result.
Combine the observations before the percentages
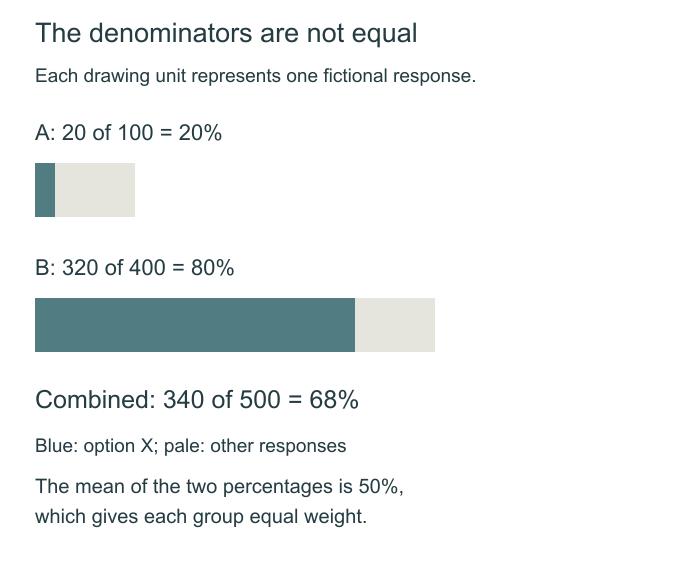
Imagine two fictional neighborhood tallies that ask the same question and count one response per person. In A, 20 of 100 responses choose option X. In B, 320 of 400 choose it. Assume the groups do not overlap and their responses can legitimately be combined. These are invented counts for a calculation, not a survey of actual neighborhoods or evidence of how residents think.
Across the two groups, 20 plus 320 gives 340 responses for X. The total number of responses is 100 plus 400, or 500. The combined share is therefore 340 divided by 500, which is 0.68, or 68%. Every counted response enters that calculation once.
The individual percentages remain correct: 20 divided by 100 is 20%, and 320 divided by 400 is 80%. The problem is not that one neighborhood's percentage was miscalculated. It appears when the two percentages are treated as though their denominators were interchangeable.
What the simple average actually gives equal weight
Adding 20% and 80% and dividing by two gives 50%. That assigns one equal contribution to each neighborhood percentage. It does not give one equal contribution to each of the 500 responses in our example. A response in the 100-person group would effectively stand behind a larger share of that two-number average than one in the 400-person group.
There could be a separate reason to describe the equal-weight mean of two neighborhood percentages. If that is the question, call it that. Do not label it the combined share of respondents. The error is answering one question and printing the result under the name of another.
Our diagram makes the denominator difference visible. The two bars use the same scale, so B is four times as wide as A. The marked portions represent 20 and 320 responses for X. Giving the bars equal overall width would make their percentages easy to compare, but would conceal the relative number of responses needed for this particular combined-share question.
The weights recover the same answer
NIST's Dataplot reference presents a weighted mean as the sum of each value multiplied by its weight, divided by the sum of the weights. For our original percentage example, use the response totals as weights: multiply 20% by 100 and 80% by 400, add those results, then divide by 500. The result is again 68%.
That is another description of the same count-based calculation, not a second piece of evidence for the fictional opinions. It works here because the group percentages are defined by the declared counts and denominators. The example does not prescribe weights for a complex survey or replace a source's published methodology.
Keep the unknown denominator unknown
If a real graphic supplies only 20% and 80%, the combined respondent share remains unresolved unless the necessary totals and definitions are available. Assuming equal group sizes merely because there are two labels would manufacture the missing input. Ask for the denominators, along with what the responses count and whether the groups can be combined without overlap.
A careful summary of our supplied example is simple: A has 20 of 100 responses for X, B has 320 of 400, and together they have 340 of 500, or 68%. That sentence keeps the arithmetic inspectable. It says nothing about a population beyond the fictional responses, a change over time or the reasons for either group's choices.
Sources & further reading
Published sources for the details and examples discussed in this story.