
More recorded incidents can accompany a lower rate per resident. There is no contradiction if the population denominator has changed enough. The count says how many events were recorded; the rate relates that count to a population and a time period. An original example with 40 and 60 incidents shows why a headline can be arithmetically correct about the count while answering a different question from a headline about the rate.
Define the two complete records
The CDC's Health, United States glossary describes a rate as a measure of an event, disease or condition relative to a population unit, with a specification of time. That definition gives the calculation a useful discipline: the numerator, denominator and period belong together. We borrow the definition, not actual health statistics, for the fictional event counts below.
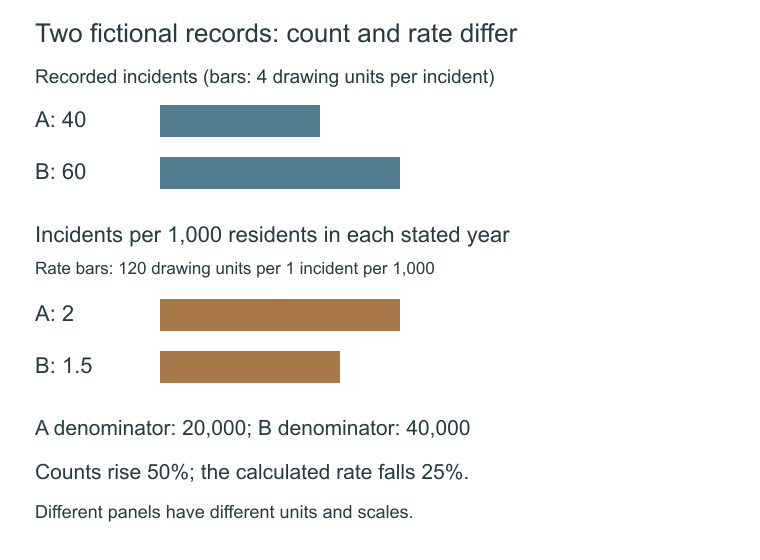
Our invented record A contains 40 incidents in a declared population of 20,000 during one stated year. Record B contains 60 incidents in a declared population of 40,000 during another stated year. Assume for this arithmetic exercise that incident definitions, coverage and population boundaries are comparable. Those are teaching assumptions, not findings about an actual city or data collection system.
The second count is larger by 20. Dividing that difference by the first count gives 20 divided by 40, or 50%. A sentence saying the recorded incident count is 50% higher describes that pair of numerators. It has not yet calculated anything per resident.
Give both records the same reporting unit
Choose a reporting unit of 1,000 residents for our example. For record A, divide 40 by 20,000 and multiply by 1,000. The result is 2 incidents per 1,000 residents for the stated year. For record B, divide 60 by 40,000 and multiply by 1,000. The result is 1.5 incidents per 1,000 residents for its stated year.
The rate is therefore lower in B, even though its count is higher. The population doubled, from 20,000 to 40,000, while the count increased by half. The denominator grew more quickly than the numerator in this invented pair. The diagram keeps the counts and rates in separate rows so that neither can silently borrow the other's unit.
Subtracting the two rates gives a fall of 0.5 incidents per 1,000 residents. Relative to the starting rate of 2, that is a 25% decrease: 0.5 divided by 2 equals 0.25. It is not a fall of 0.5 percentage points. These particular rates are stated as incidents per 1,000 residents, not as percentages of unique people.
An incident count need not count distinct people
Nothing in our example says each incident belongs to a different resident. One person could be associated with several recorded events, or the records could have another counting rule. We therefore cannot convert 2 incidents per 1,000 residents into a claim that a particular proportion of individuals experienced an incident.
The same restraint applies to risk and cause. A per-resident rate can describe a relationship between the supplied totals without proving an individual's chance of an event, explaining why the totals differ or showing that an intervention worked. Those questions require the appropriate actual evidence. Our inputs do not contain age breakdowns, exposure time or an assessment of data quality.
Let the sentence keep both results
A complete summary of the invented comparison is: recorded incidents rose from 40 to 60, while the calculated rate fell from 2 to 1.5 per 1,000 residents because the declared population rose from 20,000 to 40,000. That sentence preserves both outcomes instead of asking whether more or less is the one true description.
Before using a real pair, confirm what each numerator counts and which population and period its denominator represents. Do not divide a count for one boundary by a population for another simply because the place names look alike. If a published source supplies a specialized or adjusted rate, use its actual method rather than replacing it with this simple calculation. The purpose here is to make the denominator visible, not to treat every statistic called a rate as interchangeable.
Sources & further reading
Published sources for the details and examples discussed in this story.