
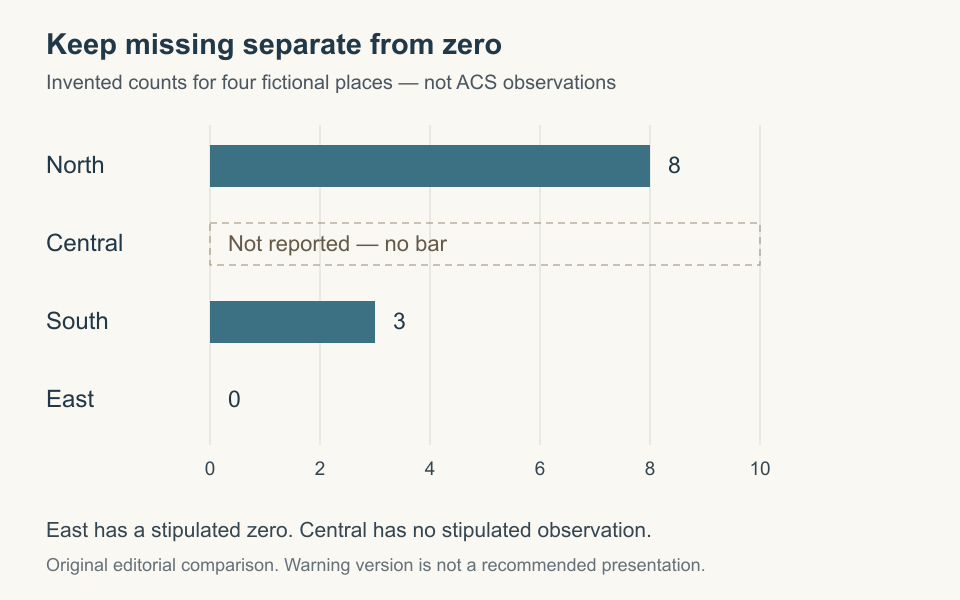
A newsletter editor has four rows and room for one neat chart. Three rows contain numbers; the fourth has no reported value. Filling that gap with zero finishes the picture, but changes its meaning. In the original example below, North, Central, South and East are fictional places. Their counts are invented to show one drawing decision, rather than report a city’s performance. Central has no stipulated observation. East has a stipulated zero. Those two rows need different treatment.
| Fictional place | Invented count | Meaning in this example |
|---|---|---|
| North | 8 | A stipulated observation |
| Central | Not reported | No observation supplied |
| South | 3 | A stipulated observation |
| East | 0 | A stipulated zero |
Read the absence before drawing it
The Census Bureau’s ACS guidance illustrates why a cell that cannot be used as an estimate needs its own explanation. Its estimate-and-annotation table assigns -888888888 and the annotation (X) to an estimate or margin of error that is not applicable or not available. It describes a null estimate as having no data available for the requested geography. Neither description supplies a measured zero.
The field matters too: an annotation is not the estimate itself. Keep the value and its accompanying annotation together when consulting these notes. These particular codes belong to the described ACS context; another city download needs its own definitions. Do not turn every blank, dash or unusual negative number in an unrelated file into the same category.
Give the missing row a visible place
Our small table assigns North eight, South three and East zero. Central remains “Not reported.” The first proposed chart keeps all four names in order. Central gets a labelled empty space rather than a bar. East keeps a printed zero. A reader can therefore distinguish an absent observation from the value we actually assigned to East.
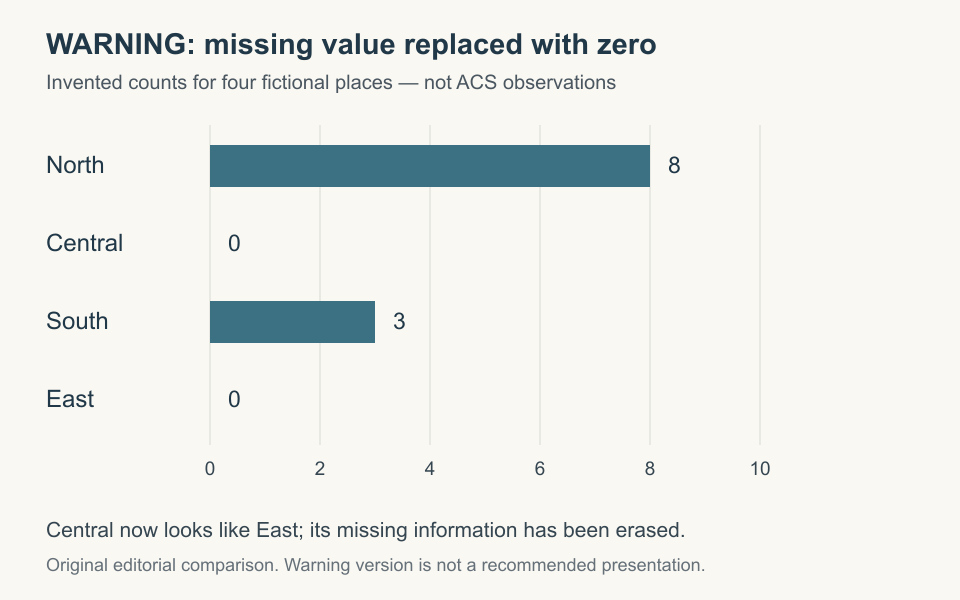
The second drawing is a warning example. It substitutes zero for Central, so Central and East receive the same numerical label. The chart looks more complete, but the original distinction has disappeared. No new observation arrived between the two drawings. The change happened in the presentation.
Keep the explanation through the export
For the imagined newsletter, a suitable caption is: “Illustrative counts for three fictional places; Central has no reported value.” Avoid describing Central as having the lowest activity. There is no count here from which to draw that conclusion.
Before choosing a charting tool or ordering a printed report, carry a small example containing both a zero and a missing entry through your proposed workflow. Inspect the resulting labels and caption rather than assuming the appearance you wanted survived export. This is an editing exercise to perform, not a claim that a particular product passed a test. Keep the original values and missing-value notes beside the working file so a later revision can recover the distinction.
Sources & further reading
Published sources for the details and examples discussed in this story.