A table picture can show what was visible without preserving the rows needed for another calculation. A data export can preserve reusable fields without preserving the appearance that helped explain them. For a city-data note, these are different jobs. An original three-row example below keeps the two together: a picture of a limited view records that view, while a separate plain-text table supplies all three declared rows. Neither file should silently stand in for the other.
Make the entire example available before judging the picture
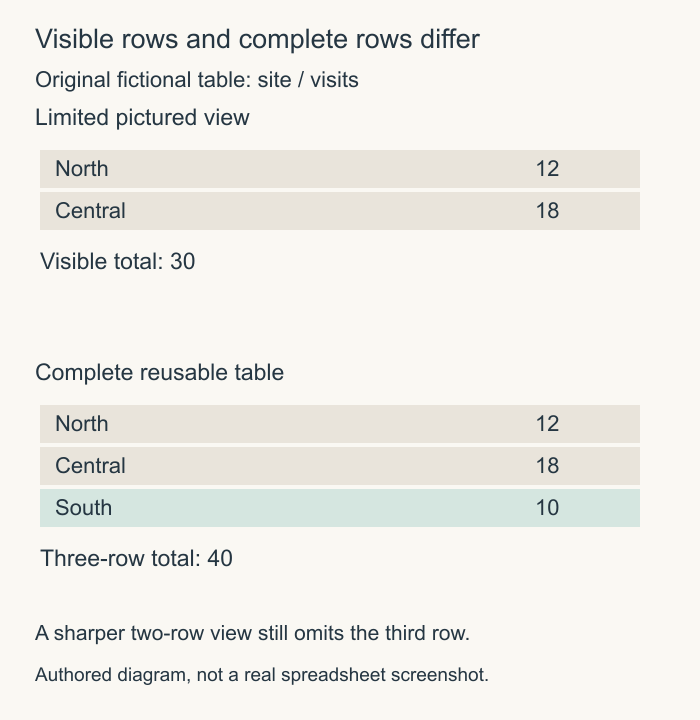
Our invented table has two columns: site and visits. Its rows are North,12;Central,18;South,10. These names and counts are fictional, not a report about real park attendance or any actual city service. The complete three-row total is 40 visits. A view showing only North and Central contains 30, leaving the South row outside that view.
This is the first preservation question: does the visible table show the intended scope? Even a perfectly sharp image of the first two rows cannot establish the unseen third count. A crop can be honest evidence of what it includes while still being incomplete for the calculation someone intends to perform.
Label the picture as a two-row view if that is what it shows. Keep the full three-row data separately. The correction is not to improve the picture's resolution and assume the missing row will become part of it. Completeness of the selected area is a separate issue from how clearly that area is reproduced.
A static picture and cells serve different tasks
Microsoft's Excel guidance for Microsoft 365, Excel 2024 and Excel 2021 describes copying cells, a chart or an object as a static picture. Its documented route uses Home, Copy, Copy as Picture. That is useful when the intended result is a picture of a selected arrangement. The word static matters: this output is not a claim that the recipient receives the underlying worksheet cells.
For our example, the two-row picture can accompany a discussion about the limited view someone received. To independently sum all three sites, a reader instead needs the actual declared values in a usable representation. They could retype visible numbers, but that would create a new transcription to verify; it would not recover a row absent from the image.
The original diagram accompanying this article contrasts those two scopes. It is an authored illustration, not an Excel screenshot or a screen from a real city portal. Its purpose is to keep the missing South row visible in the explanation while retaining the fact that it was absent from the smaller pictured view.
A CSV preserves a different kind of simplicity
The plain-text version of our complete example has a header and three records: site,visits;North,12;Central,18;South,10, with each record on its own line. The comma separates fields in this deliberately simple example. A reader can count three data rows and verify that 12 plus 18 plus 10 equals 40 without relying on which rows happened to fit a picture.
Microsoft's separate text-format guidance explains that saving an Excel workbook in a text format removes formatting. Its CSV description also specifies that only the active sheet is saved. Thus an exported text file should not be described as a complete preservation of every worksheet, formula, layout and feature in a workbook merely because the export succeeded.
The right comparison depends on the job. If someone needs the visible arrangement for a design comment, retain the labeled picture. If they need the three values for this calculation, retain the full data table and its field meanings. If they need the original workbook's richer behavior, a plain-text export alone is insufficient. One convenient attachment does not automatically cover all three purposes.
Check the handoff rather than trusting the filename
For this example, a useful handoff note says three data rows, site names North/Central/South, visits 12/18/10, total 40; pictured view contains North/Central only. Those concrete checks let the recipient distinguish a missing row from an arithmetic disagreement. They also let the sender state the scope without claiming a real dataset was tested.
In an actual city-data task, keep the original source, its relevant definitions and the date or version with the derived files. Confirm which sheet and rows were exported and inspect the result against that source. A CSV extension does not itself prove completeness or correct interpretation. The usable outcome is a picture whose limited scope is understood and a data file whose actual records can be checked.
Sources & further reading
Published sources for the details and examples discussed in this story.